As part of our MBC 2.0 evolution, we continue to expand how organizations use data not just to measure care, but to improve it, demonstrate impact, and strengthen their position in funding and payer conversations.
Since launch, our MBC Benchmarking feature has been empowering clinical leaders and administrators with a clear view of high-level MBC outcome and engagement data standards. It has unlocked the ability for clinics to identify improvement areas, recognize their strengths, and equip themselves with the essential data to succeed in value-based care contracting and negotiations. As North America’s leading MBC platform, our benchmarking feature uniquely equips clinical leaders with the insights needed to better understand their strengths and identify improvement areas for their MBC implementation.
As of January 2026, we’ve upgraded the value and precision of our benchmarking tools by delivering apples-to-apples benchmark comparisons, enabling organizations to evaluate their data within the specific context of their treatment offerings. We’ve also incorporated severity-adjusted outcome metrics, expanded therapist engagement tracking, and improved dashboard usability to help organizations better understand their performance, drive operational improvements, and strengthen their value proposition for funding and contracting.
What is MBC Benchmarking?
This feature allows clinical leaders to assess their performance across key MBC metrics and identify improvement areas by comparing their organization’s usage and outcome data against industry benchmarks, established across more than 500 MBC implementations. The feature provides our clinical partners with a comparison of their results against the industry average (median) and high performing clinic (75th percentile). This context helps leaders identify strengths, pinpoint improvement opportunities, and prioritize investments that support both care quality and operational performance.
With insight into how your organization is performing across adoption, engagement, and outcomes, clinical leaders can more easily determine where to invest resources and address gaps in their service delivery.
The Problem: Why it matters
Many of the organizations we work with are implementing MBC for the first time and can find it difficult to gauge how their usage, client/clinician engagement, and outcomes compare to their peers. We believe that it’s essential for organizations to feel empowered to interpret their MBC data alongside industry benchmarks. This comparison helps them understand their performance, pinpoint areas for improvement, and identify actionable steps to enhance these areas, as well as their overall implementation.
Importantly, there are no established MBC benchmarks for the mental health industry. As a result, many practicing MBC must review their data in isolation and without context as to what a strong MBC implementation looks like. This is particularly challenging for organizations in the first year of their implementation, when strong adoption and engagement are necessary to build a robust data set that allows for year over year comparison and ongoing quality improvement.
Benchmarking data is also essential for funding, accreditation, and value-based care negotiations, as it enables organizations to clearly understand and share the impact of their services, as they work to set new standards for impactful, high-quality care.
What’s new as of January 2026
With the new release of MBC Benchmarks, benchmarking has moved beyond high-level averages to deliver clinically and operationally meaningful comparisons:
- Treatment-category benchmarks allow organizations to compare themselves against peers delivering similar types of care (e.g., Community Mental Health Outpatient, Facility-Based SUD, School-Based Services).
- Severity-adjusted outcome metrics enable fair comparisons across organizations serving populations with different baseline symptom severity.
- Expanded therapist engagement tracking adds visibility into whether clinicians are actively viewing and using MBC results.
- Improved dashboard hierarchy and usability makes it easier to interpret benchmarks and act on insights.
Together, these improvements make Greenspace’s benchmarking experience more credible, actionable, and aligned with how clinics actually operate. By offering data that reflects each organization’s unique context MBC Benchmarks helps providers better interpret their performance, identify opportunities for improvement, and confidently use their data in both internal quality initiatives and external funding discussions.
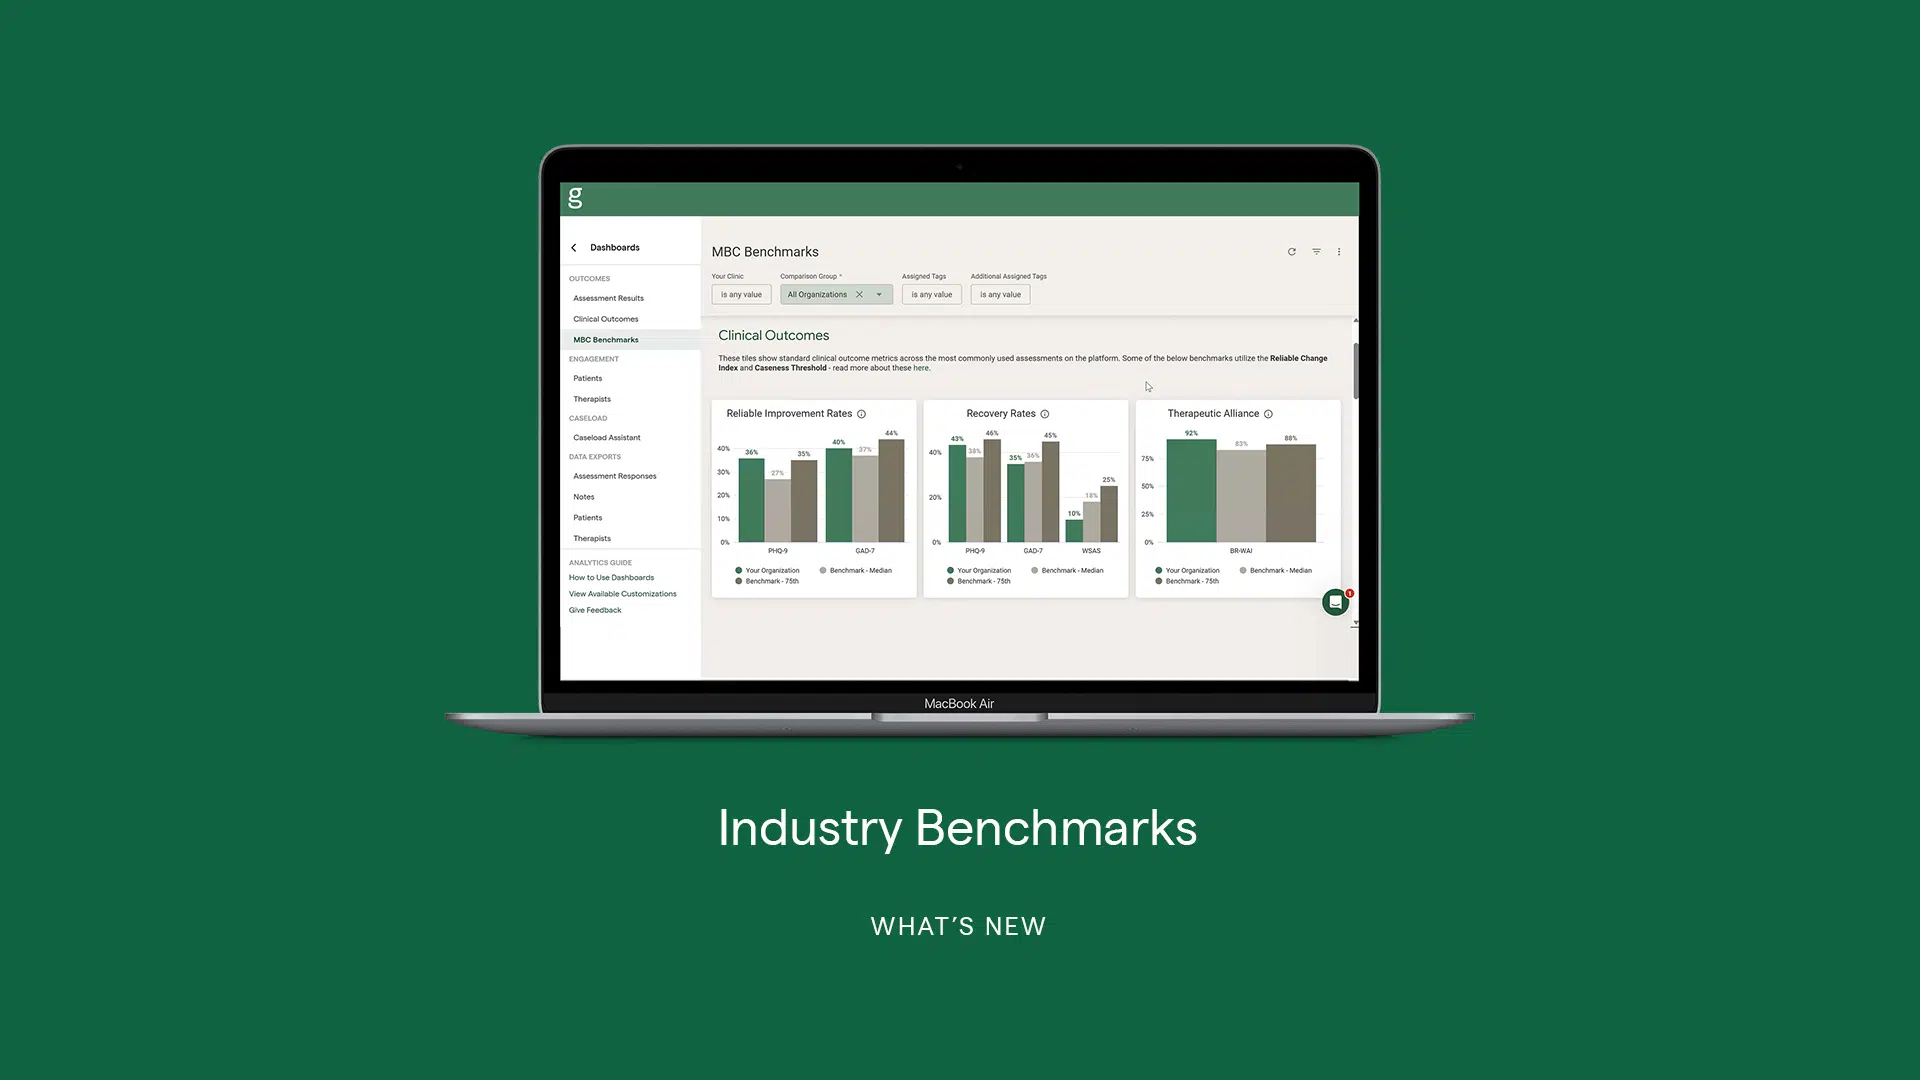
Below is a sneak peek of what this looks like within Greenspace’s Analytics dashboard:
How it works
Given our partnership with hundreds of organizations across North America—including private clinics, hospitals, community agencies, and more—spanning diverse service modalities and demographics, we are uniquely positioned to provide an accurate, data-driven view of what successful and high-performing MBC implementations look like, from initial adoption onward. Here’s how organizations can leverage the MBC benchmarks dashboard to amplify their impact and reporting:
1. Treatment-Specific, Apples-to-Apples Comparisons
Organizations can now filter benchmarks by treatment category, ensuring comparisons reflect similar care settings and service models. This eliminates misleading averages and enables far more relevant performance assessments.
2. Severity-Adjusted Outcomes
MBC Benchmarks incorporates severity-adjusted improvement scores, allowing organizations serving higher-acuity populations to fairly demonstrate outcomes relative to peers. This added rigor is especially important for payer, funder, and value-based care discussions.
3. Expanded Therapist Engagement Metrics
New metrics show the percentage of therapists actively viewing results, providing insight into whether MBC data is being used in care. This helps leaders identify coaching, supervision, and workflow opportunities that drive stronger outcomes.
4. Improved Dashboard Structure
The dashboard prioritizes what matters most, displaying key metrics across three core areas:
- Adoption: These tiles represent the proportion of clients and clinicians that are actively engaged with MBC. This section provided insights into the adoption rate of MBC across other organizations, helping you understand how your organization’s engagement compares. Metrics include the percentage of clients with assigned assessments, overall percentage of clients consistently completing assessments, and the percentage of your clinicians with clients actively completing assessments.
- Engagement: These tiles indicate the level of ongoing interaction and utilization of MBC among clients and clinicians. Consistent engagement with MBC is essential for continuously improving quality of care and achieving enhanced clinical outcomes. Metrics include ongoing assessment completion and recent client/clinician activities.
- Clinical Outcomes: These tiles display key clinical outcome metrics across the most commonly used evidence-based assessments, enabling organizations to compare their outcomes with peer benchmarks. Metrics include rates of reliable improvement, recovery, and therapeutic alliance.
This hierarchy reflects how leaders evaluate MBC success and supports faster, more intuitive insight.
5. Enhanced Usability
Clearer labels, improved tooltips, and a streamlined layout make benchmarks easier to interpret and apply across internal improvement initiatives or external reporting.
These insights allow leaders to move beyond surface-level reporting and toward targeted, data-informed action.
The MBC Benchmarks feature is available to all Greenspace administrative users directly within their Analytics Dashboard. With this new release, benchmarking has evolved into a more precise, credible, and actionable tool, one that supports both better care delivery and stronger organizational performance.
To learn more about MBC Benchmarks and how it can support your MBC implementation, schedule a call with an implementation expert or reach out anytime at info@greenspacehealth.com.